
There is a well-known anecdote about a couple of a certain age who go to the hospital because she feels a slight pain in her chest. The doctor takes an electrocardiogram, looks at her and says to her husband: “Your wife has a heart attack”. And then the husband says, “I understand, doctor. But apart from that, is there anything serious?”
Galvani and frogs
The electrocardiogram (ECG or EKG, from the German Elektrokardiogramm) is the graphical representation of the electrical activity of the heart as a function of time.
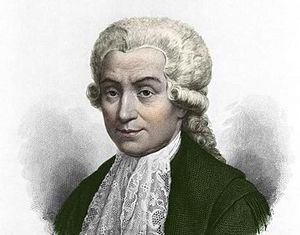
The history of the electrocardiogram (ECG) begins with the physician, physicist and professor at the University of Bologna Luigi Galvani (1737-1798), among many other things known for being the first scientist able to describe accurately the olfactory and auditory organs of birds.
Around 1780, he started to conduct experiments in front of his students in which he used to be able to make a dead frog jump by applying an electric current to its spinal cord. Galvani interpreted that the muscles of living beings store electrical energy, which provoked an intense debate with his colleague at the University of Pavia Alessandro Volta.
Today, we know that the explanation lies in the electrical nature of the nerve impulse, something that was difficult to accept at that time.
Galvani was surrounded by interesting stories, some of them tragic. Thus, it seems that his dispute with Volta stimulated the latter’s work to the point that he ended up designing the first voltaic pile, which, in turn, is at the origin of the contributions of Benjamin Franklin and Henry Cavendish. He held the chair of Anatomy at his university until 1797. In that year, the Napoleonic invasion took place and the professors were “invited” to sign an oath of allegiance to the Emperor Napoleon Bonaparte; Galvani refused and as a result was immediately expelled. He died less than a year later.
After his death, experiments on human beings similar to those performed by Galvani followed. One of them was carried out in 1803 by his nephew Giovanni Aldini, apparently with surprising results. These experiments were made known throughout Europe and were applauded by many scientists and intellectuals, including Erasmus Darwin (Charles’s grandfather), Lord Byron and the poet Percy Bysshe Shelley. The latter’s enthusiastic wife, Mary Shelley, conceived the story of the monster created by Dr. Frankenstein in 1816; for more details on all this, see [2].
Galvani’s name has survived with the terms galvanising, galvanic corrosion and galvanometer, among others. In particular, the galvanometer is an instrument used to detect and measure electric current (it produces a rotation in a needle in response to electric current flowing through a coil).
Waller and Einthoven
Augustus Desiré Waller (1856-1922) was a British physiologist. He was professor at the London School of Medicine for Women, St Mary’s Hospital and then at the British Royal Institution, holding the Fullerian Chair of Physiology.
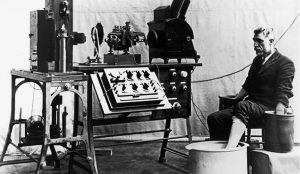
In 1887, he was able to record the first human ECG with a machine of his invention, the first in history to use electrodes attached to the skin.
Interestingly, Waller did not believe in the usefulness of ECGs for medical purposes. It took him some time to be convinced. It was only after numerous contacts with other colleagues that he realised that the observed values allowed him to determine behaviour and diagnose possible pathologies.
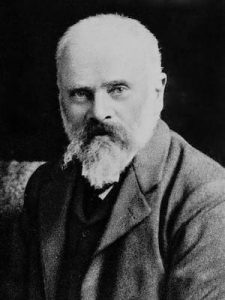
Willem Einthoven (1860-1927) was a Dutch physician and physiologist. He was professor of Physiology and Histology at the University of Leiden, where he carried out his research work. In 1902 he became member of The Royal Netherlands Academy of Arts and Sciences.
Around 1901, he introduced the string galvanometer, a device with which he was able to record the electrical activity not only of the heart, but also of other muscles in the body. Five years later, he gave a detailed description of the clinical applications in an article that has been fundamental for the development of this tool, now used in the Emergency Department, Internal Medicine, Cardiology, Intensive Care Unit and the Coronary Unit in hospitals all over the world.
In 1924, he received the Nobel Prize in Medicine and Physiology for his decisive contributions to the medical diagnosis of cardiovascular diseases.
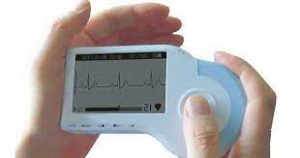
Nowadays, there are many hand-held devices that allow ECGs to be performed. This contrasts with the dimensions of the devices invented by Waller and Einthoven. However, much of the terminology used has its origins in Einthoven: the assignment of the letters P, Q, R, S, T and U to the recordings, the thoracic triangle (or Einthoven’s triangle) and so on.
What is an ECG, what does it indicate and what is it for?:
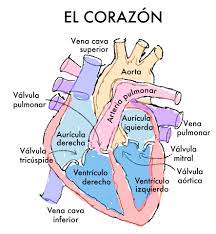
To complete the cardiac cycle satisfactorily, the heart must contract in a periodic and orderly pattern. This is the result of electrical impulses generated and transmitted in specific muscle fibres that produce a characteristic pattern of voltage variations (potentials are generated at the cellular level, i.e. each cell is a tiny voltage generator).
The ECG produces a curve indicating the electrical activity of the heart as a function of time. It is obtained from data taken from the surface of the body in a non-invasive physical test and is the most effective diagnostic tool for cardiovascular disease, metabolic disorders and risk or predisposition to cardiac arrest.
The result is a collection of voltage measurements between pairs of electrodes, also called “leads”. The electrodes are combined to measure different signals from the heart. Thus, each lead can be interpreted as a ‘photograph’ of the heart’s electrical activity, taken from a different angle.
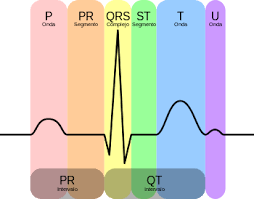
A typical electrocardiogram tracing recording a normal heartbeat consists of a P wave, a QRS complex and a T wave. It also includes a small U-wave that is normally invisible. These waves should have characteristics that can now be accurately described; see Fig. 4. In general, abnormalities can be interpreted in terms of possible pathology. For example, Q waves that are too broad and too deep indicate myocardial infarction to a lesser or greater degree, abnormalities in the QRS complex may indicate tachycardia or other ventricular abnormalities, etc.
Two mathematical models
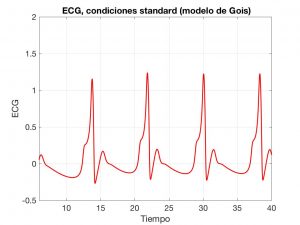
First, we will look at a model based on ordinary differential equations (ODEs), proposed by Gois and Savi in [4]; see also [5]. Essentially, it is a system with three coupled Van Der Pool-type oscillators.
Generally speaking, an oscillator is a system capable of creating periodic or quasi-periodic disturbances or changes in a medium. These disturbances may relate, for example, to the propagation of acoustic or electromagnetic waves. In particular, an electronic oscillator is a circuit that can convert direct current into alternating current undergoing periodic variations in time.
In Gois’ model, there are three oscillators, each associated with an area of the heart: the sino-atrial and atrio-ventricular nodes and the His-Purkinje system (a bundle of fibres that transmit electrical impulses to different regions within).
In a simplified version, the EDOs are:
$$
\left\{
\begin{array}{l}
\ddot x = -a_1 \dot x (x – w_{1,1}) (x – w_{1,2}) – x(x + d_1)(x + e_1)
\\
\phantom{\ddot x = }+ \rho_1 \sin(\omega_1 t) – k_1 (x – y) – k’_1 (x – z),
\\
\ddot y = -a_2 \dot y (y – w_{2,1}) (y – w_{2,2}) – y(y + d_2)(y + e_2)
\\
\phantom{\ddot y = }+ \rho_2 \sin(\omega_2 t) – k_2 (y – x) – k’_2 (y – z),
\\
\ddot z = -a_3 \dot z (z – w_{3,1}) (z – w_{3,2}) – z(z + d_3)(z + e_3)
\\
\phantom{\ddot z = }+ \rho_3 \sin(\omega_3 t) – k_3 (z – x) – k’_3 (z – y),
\end{array}
\right.
$$
where the \(a_i\), \(w_{i,j}\), \(d_i\), etc. are positive constants. In particular, the couplings are governed by the \(k_i\) and the \(k’_i\).
The \(x\), \(y\) and \(z\) variables describe the oscillations. Once the waves they generate are combined, we obtain the typical ECG shape; see Fig. 6.
More complete models can be used to describe the electrical activity of the heart, based on systems of partial derivative equations (PDEs); see [6] for a detailed description. In particular, in bi-domain models, the solutions are the space-time functions \(u_i\), \(u_e\) and \(w\), which are interpreted as follows:
- \(u_i\) and \(u_e\) are the intra- and extra-cellular electric potentials. Often, \(V := u_i-u_e\) and \(u_e\) are calculated.
- \(w\) is the ionic variable. It determines the ionic current generated by \(V\) and, in turn, influences the evolution of this unknown.
Various constants, vectors and functions appear in the equations: the intra and extra-cellular conductivity tensors \(\sigma\) and \(\mu\), the external stimulus current \(I_0\), other phenomenological constants, etc.
In abbreviated notation, the structure of the system of equations is as follows:
$$
\left\{
\begin{array}{l}\displaystyle
\partial_t V – \nabla\cdot(\sigma \nabla V) + I(V,w) – \nabla\cdot(\mu \nabla u_e) = I_0,
\\ \displaystyle
– \nabla\cdot((\mu+\sigma) \nabla u_e) – \nabla\cdot(\sigma \nabla V) + a_0 V = 0,
\\ \displaystyle
\partial_t w + g(V,w) = 0.
\end{array}
\right.
$$
That is, a nonlinear reaction-diffusion PDE coupled with an elliptic PDE and a nonlinear ODE. The models use different \(I\) and \(g\) functions whose choice corresponds to the role played by \(w\).
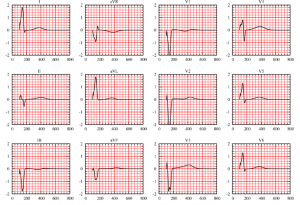
These PDEs have to be completed with appropriate boundary conditions for \(V\) and \(u_e\) and initial (or time-periodic) conditions for \(V\) and \(w\). The detailed analysis of the existence and uniqueness of solution can be found in [7]. Moreover, its numerical resolution confirms the efficiency and accuracy of the model; see Fig. 7.
Once the model has been chosen, a complete theoretical analysis (existence, uniqueness, regularity of solution) has been carried out and the numerical resolution has been devised and polished, it makes perfect sense to ask several questions:
- How can we systematically associate the results provided by the model with the different cardiac pathologies (ischaemia, infarction, tachycardia, etc.).
- How can we identify the parameters corresponding to a subject from observations. As in many other situations, this corresponds to posing and solving appropriate inverse problems.
- How can we determine possible therapeutic actions in abnormal situations. Once again, we find here interesting optimal control problems.
Two researchers who have contributed with great success to the analysis and resolution of these models are Muriel Boulakia, Professor at the Université Paris 6 and Miguel Ángel Fernández, Research Director at INRIA.
Learn more
-
Much information on the origins and development of electrocardiography can be found at https://www.e-mergencia.com/html/historia_ecg/
-
J. Burnett, The origins of the electrocardiograph as a clinical instrument. Medical History Supplement 5: 1985, 53-76, In “The emergence of modern cardiology”. Bynum WF, Lawrence C, Nutton V, eds. Wellcome Institute for the History of Medicine: 1985.
-
S. Gois, Sandra, M.A. Savi, An analysis of heart rhythm dynamics using a three-coupled oscillator model. Chaos, Solitons and Fracctals, Vol. 41, 2009, pp. 2553-2565.
-
M.A. Quiroz Juárez, O. Jiménez Ramírez, R. Vázquez Medina, Análisis e implementación de un modelo matemático para generar señales de electrocardiograma sintéticas. Conference MATECOMPU 2015, Varadero, Matanzas, Cuba.
-
R.H. Clayton, A.V. Panfilov, A guide to modelling cardiac electrical activity in anatomically detailed ventricles. Progress in Biophysics and Molecular Biology, 96:19-43, 2008.
-
M. Boulakia, M.A. Fernández, J.-F. Gerbeau, N. Zemzemi, A coupled system of PDEs and ODEs arising in electrocardiograms modeling. Appl. Math. Res. Express. AMRX, (2): Art. ID abn002, 28, 2008. In this paper, the behaviour of the solutions of the presented EDP-EDO model is analysed in detail.
-
M. Boulakia, S. Cazeau, M.A. Fernández, J-F. Gerbeau, N. Zemzemi, Mathematical modeling of electrocardiograms: a numerical study. Ann. Biomed. Eng., 38(3):1071-1097, 2010. This paper contains numerous numerical experiments confirming the validity of the EDP-EDO model.
Leave a Reply