
Many aspects of the mechanisms of infection of the SARS-CoV-2 coronavirus are still unknown, as it is a new pathogen for our species. Undoubtedly, the large amount of information that reaches us during the confinement to which we are subjected means that terms such as “viral load” and “infective dose” are among the concepts that we read or hear almost daily. And, yes, these are concepts for which mathematical modelling tools can help in their description. Moreover, modelling even helps to generate specific values for these parameters, something that is not always easy in the clinical setting.
Determining the values, or ranges of values, for viral load or infective dose can be useful for decision-making for different scenarios. For example, knowing the value of the infective dose at which the virus is able to overcome the immune response, i.e. our system cannot win the fight, or estimating how small a dose of virus, and with what frequency and continuity, can cause a threshold to be reached that results in the virus also winning over our immune system. The first scenario is one in which anyone can become infected after a single contact with an infected person who, with a high viral load, emits so much virus that the recipient is guaranteed to get the infectious dose. The second scenario is one in which we may encounter small amounts of virus left in the environment or on contaminated surfaces on a day-to-day basis, something we discussed in another entry of this blog.
Specifically, in this post we will discuss the concepts of “viral load” and “infectious dose”, concepts that are deeply rooted in epidemiological studies, and which need a bit of mathematics to be fully understood.
Thus, “viral load” is defined as the amount of virus inside the infected person, and “infective dose” is the minimum amount of viral particles needed to produce infection. Clearly, while the infectious dose is a more or less specific number that is only considered at the start of the infection, the viral load varies throughout the process, as the amount of virus increases as it replicates inside the first infected cells, and even more so as new particles infect other cells in the body. This number (viral load) may therefore increase until it kills the individual, or it may decrease until it disappears altogether as the immune system responds.
For SARS-CoV-2, the actual minimum infective dose is not known, nor for most viruses, but it is estimated that 100 virus particles that infect one or two cells in the lung (specifically the so-called type II alveolar cells) may be enough to cause the virus to replicate and infect other cells. At the experimental level, the infective dose is established by calculating the TCID50, which is the dose of virus capable of infecting \(50\%\) of the cell cultures used, as defined in the above-mentioned entry of this blog.
On the other hand, viral load is directly related to the number of viral particles that the infected individual can emit when talking, sneezing or coughing. The number of coronavirus particles has been found to peak 5-6 days after infection, with values in the range of \(10^4-10^7\) particles per ml. The severity of symptoms is also often related to viral load so that symptoms tend to be more severe in patients with a higher viral load.
How does a virus infect us?
There are two factors that influence how a virus will infect us. Once a virus enters our body (usually via the mouth, nose and eyes) there are two processes to consider:
- How long does it take for viral particles to attach and enter cells?
How many viral particles enter our cells (e.g. lung cells)? - Let’s consider both processes briefly:
Once the virus enters through the respiratory system of an individual, the first step of infection consists of virus attachment, which, from a physico-mathematical point of view, depends on the probability of the virus and the cell meeting and thus on the concentration of both (see page 124 of [1]). Thus, the \(U\) rate of virus-cell attachment can be described, to a first approximation, by the following kinetic equation:
$$
\frac{dU}{dt} = k[V][C] ,
$$
where \(t\) is the time, \([V]\) and \([C]\) the virus and cell concentrations, respectively; and \(k\) the kinetic constant, which in our case will be determined by the intensity of recognition between the two (it is known that viruses enter through certain areas of cells, and that some cells are more likely to be infected than others). Clearly, this is a very simple representation of the infection process, as there are many variables that will determine whether the virus reaches and finds the specific receptor molecule on the right cell. Nevertheless, it is certainly a good starting point for modelling the infection process. In particular, it follows from the kinetic equation above that the rate of binding between the virus and its host cells increases with the number of viral particles entering the host.
Now let’s see how, once the virus has attached to the cell, we can describe in a simple way the impact of the so-called “multiplicity of infection” (MOI), i.e. how many infectious particles there are per cell (see page 50 of [1]). For example, if we have a culture where there are \(10^6\) cells and \(10^7\) viruses, the MOI is 10, and if we have \(10^6\) cells and \(10^6\) viruses, the MOI is 1.
Suppose the viruses and cells are in suspension. Whether the two meet will depend, as we have already said, on the random collision between them. Some cells will not be joined by any virus at all; others by one, or two, or three, and so on ad nauseam. The probability of a cell being joined by one, two, or more viruses (and thus downloading their genetic material into it) follows a Poisson distribution
$$
P(k) = \frac{e^{-m} m^k}{k!} ,
$$
where \(P(k)\) is the fraction of cells infected by \(k\) virus and \(m\) is the MOI, which can be calculated from the proportion of cells not infected \(P(0)\) in a controlled experiment. Let’s look at this with an example:
If \(k\) is zero, then \(P(0)\) is the proportion of cells that are not infected and, therefore,
$$
P(0) = e^{-m} \quad \Rightarrow m = -\ln P(0).
$$
Let’s imagine that we have a culture with a MOI \(= \)10$. Then the fraction of cells infected by \(0\), \(1\) and more than \(1\) virus, can be easily obtained as follows:
For fraction of cells that are not infected, \(P(0)\), we have
$$
P(0) = e^{-10} = 4,5\cdot 10^{-5} ,
$$
which, in a culture of \(10^6\) cells, corresponds to 45 uninfected cells, i.e. almost none.
The fraction of cells that are infected with 1 virus, \(P(1)\), will be
$$
P(1) = 10\cdot 4,5\cdot 10^{-5} = 4,5\cdot 10^{-5} ,
$$
which, in a culture of \(10^6\) cells, corresponds to 450 cells infected with 1 virus.
The fraction of cells infected with more than 1 virus, \(P(>1)\), will therefore be
$$
P(>1) = 1-P(0)-P(1)=1- e^{-m} \cdot (m+1) = 0,9995,
$$
which, in a culture of \(10^6\) cells, corresponds to \(999500\), i.e. almost all cells will be infected by one or more than one virus.
Thus, if we want to ensure that \(99\%\) of the cells in a culture are infected, the MOI required will be
$$
P(0) = 1\% = 0,01 \quad \Rightarrow m = -\ln(0,01) = 4.6.
$$
It should be noted that it is practically impossible to know the MOI value for an individual, it is rather a theoretical indicator of the proportion of how many cells are infected and by how many viruses. From the examples considered, it is also clear that if the MOI is high, then the probability of a large number of cells becoming infected increases considerably. On the other hand, if the initial virus concentration in our lung cells, for example, is very high then the binding rate is greater and therefore the viruses can penetrate the cells more quickly, so that we can more easily contract the disease.
As a conclusion
In conclusion, the two factors discussed in this entry lead us to the conclusion that it is advisable to avoid places where there may be a higher concentration of virus and, if there is no alternative, to wear suitable protection with masks and gloves and to avoid touching mouth, nose and eyes. Given that, as mentioned at the beginning of this entry, people with COVID-19 (with or without symptoms [2]) tend to have a high viral load (seemingly higher when symptoms are more severe, but not necessarily), and therefore expel much more viral particles when sneezing, coughing and even when talking, it is especially important that healthcare workers who have to treat them take extreme precautions and provide them with appropriate means of protection. Likewise, when de-escalation from lockdown begins, we must all be aware of the danger of contagion and take every appropriate measure.
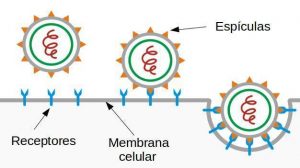
Finally, we have to mention that what has been discussed in this section only describes in broad outline how infection begins, and is general enough to ignore the specific mode of entry of the virus into the cells (in the case of SARS-CoV-2, as in the rest of the coronaviruses, it is by endocytosis [3], the scheme of which can be seen in figure 1). If we want to describe how it develops inside the organism, we need more complex dynamic models. In a future post we will try to present some of the possible mathematical models that allow us to describe and interpret how a viral infection develops in our organism.
If you want to download the pdf of the post click AQUÍ.
Bibliography
[1] S. Jane Flint, Vincent R. Racaniello, Glenn F. Rall, Anna Marie Skalka, Lynn W. Enquist, Principles of Virology, 3º ed., Vol 1. American Society for Microbiology Press, Washington DC, 2015.
[2] Monica Gandhi, Deborah S. Yokoe, and Diane V. Havlir, Asymptomatic Transmission, the Achilles’ Heel of Current Strategies to Control Covid-19,
The New England Journal of Medicine, April 24, 2020. DOI: 10.1056/NEJMe2009758
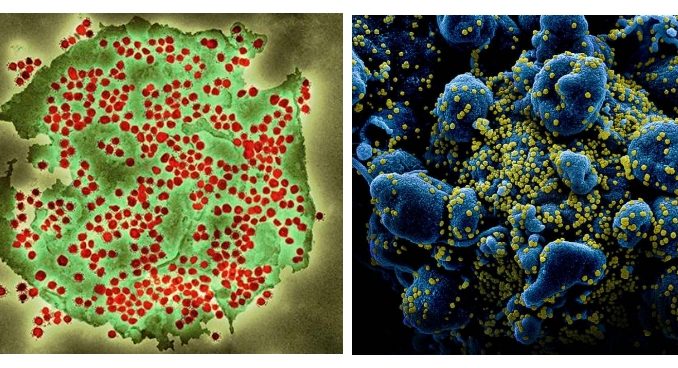
[3] source of the figure 2 images. Left: Coloured transmission electron micrograph (TEM) of a SARS-CoV-2 coronavirus particle isolated from a UK case of the disease Covid-19. SARS-CoV-2 (https://publichealthmatters.blog.gov.uk}). Right: Colorized scanning electron micrograph of an apoptotic cell (blue) heavily infected with SARS-COV-2 virus particles (yellow), isolated from a patient sample. Image captured and color-enhanced at the NIAID Integrated Research Facility (IRF) in Fort Detrick, Maryland. Credit: NIAID (https://www.flickr.com/photos/niaid/)
muy bien exPlicaDO