
In my post How to estimate the actual number of infected by covid-19? Andalusia and Italy cases on 16 March, I presented a method for estimating the number of people actually infected by Covid-19 using the age segmentation of the number of deaths and the mortality ratios by age groups in South Korea. This method did not allow me to do the calculations for Spain because I did not have the necessary data at that time. Since then, the Department of Health’s website has published several updates of deaths by age group, although they are only for a part of those infected (I imagine because not all autonomous regions report this data, or for some other administrative reason). As of 29 March, the data segmented by age included figures of 51,626 infected detected and 2,784 deaths; that is 63% of the infected detected and 39% of the total deaths. This obvious bias makes it impossible to use my method to calculate how many people are actually infected in Spain.
As I think it is important for the public to have access to these estimates, I am going to comment here on an paper that has just been published on the website of Imperial College London on estimates of the number of people actually infected in 11 European countries. It is entitled:
“Estimating the number of infections and the impact of non-pharmaceutical interventions on COVID-19 in 11 European countries”. You can download it here:
It is signed by a large group of more than sixty researchers led by Seth Flaxman, Swapnil Mishra and Axel Gandy, from several departments at Imperial College London (Infectious Disease Epidemiology, Mathematics, among others) and other institutions (Department of Statistics at Oxford, among others). Due to lack of time, and as far as I know, the paper has not yet passed the usual peer review filter for scientific papers. I would like to take this opportunity to thank David Gómez-Ullate for bringing this paper to my attention.
But before I go any further, I would like to make an observation. In the post Hunger and numbers that I dedicated in this blog to the magnificent book Hambre by Martín Caparrós, I commented on Caparrós’ unease at using such an apparently aseptic tool as numbers to count the hungry. Something similar happens to me when it comes to writing about counting and estimating the infected and the dead. I know that in the statistical treatment of diseases it is inevitable to compute deaths with numbers, but it is worth remembering from time to time that behind those numbers there are human beings, and that each number that we now associate with a death used to count a life (and I would almost ask the reader to think for a moment about the richness that the double meaning of the word count brings in this context: in spanish “contar” can be to number or compute, on the one hand, to narrate true or fabricated events, on the other). In any case, this consideration is not far from the philosophy that inpires this Blog: numbers, mathematics, are often as much a matter of the heart as of the head.
As the title of the paper indicates, it estimates the number of infected people in 11 European countries as of 28 March, as well as the effects that the various containment measures implemented in these countries have had on the Covid-19 epidemic. It uses a hierarchical Bayesian model and several working hypotheses. These include that containment measures produce immediate changes in the rate of reproduction \(R_t\) of the virus rather than gradual changes in infection behaviour (\(R_t\) is a measure of how easy the virus is to infect: \(R_t\) represents the average number of infectees each infected person causes over the course of the infection). The authors also assume that the same measures produce similar effects on changes in \(R_t\) in different countries; although these effects on the epidemic may be different, depending on the values of \(R_t\) and the actual number of infected in each country at the moment the containment measures are applied. This is one of the reasons why it is so important to have estimates of the actual number of infected.
The authors conclude that the various containment measures undertaken in these countries have saved 59,000 lives as of 31 March (with a 95% probability that the number of lives saved is between 21,000 and 120,000). And they claim that many more lives will be saved if containment measures are maintained until transmission drops to very low levels.
The eleven countries studied are Austria, Belgium, Denmark, France, Germany, Italy, Norway, Spain, Sweden, Switzerland, the United Kingdom and the United States. The authors estimate that between 7 and 43 million people were infected in the eleven countries studied as of 28 March (representing between 1.88% and 11.43% of the population).
In the case of Spain, the authors estimate that 15% of the population was infected as of 28 March (the highest percentage of the 11 countries studied). This estimate gives six million infected people, although the range of the confidence interval puts the figure between 1.8 million and 19 million with a probability of 95%. One of the tools used by the authors is the evolution of the number of deaths, and this has been heavily conditioned in Spain by the tremendous situation experienced in old people’s homes (in some autonomous communities, homes account for up to 50% of deaths). Perhaps this has introduced a bias that causes the number of infected to move in the lower part of the confidence interval in the case of Spain.
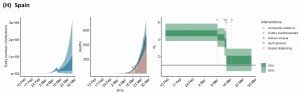
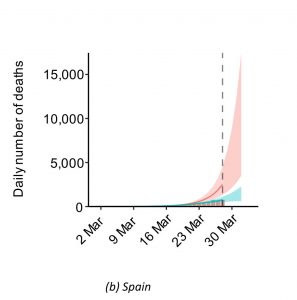
The box on the left of the image above shows the evolution of the number of actual infected per day in Spain. The effects of confinement can also be seen, in the form of an abrupt containment of the infection, as the reproduction rate \(R_t\) decreases, although it continues to grow because the reproduction rate has not fallen below 1 (the dark green area indicates the confidence interval for the curve of actual infected per day). The central box corresponds to the death curve. For Spain, the authors estimate 16,000 deaths avoided by containment measures, with a 95% probability that between 5,400 and 35,000 lives have been saved. The following image shows the estimated number of deaths with (red) and without (green) containment.
In terms of the percentage of those actually infected, Italy is next with 9.8% of the population infected as of 28 March, which also gives nearly six million infected, with a 95% probability that the number of infected is between 1,900,000 and 15,200,000. Perhaps somewhat surprisingly, with Italy having 60% more deaths than Spain, the actual number of infected is similar. The authors explain that in their model, not only the number of deaths but also their evolution over time is fundamental, as they deduce changes in the reproduction rate by calculating backwards from the evolution of the number of deaths, thus estimating what transmission was like weeks before. This may explain the apparent contradiction, as the evolution of the number of deaths in Spain has been somewhat faster than in Italy.
Of the countries studied, Germany is one of those with the lowest percentage of people actually infected, estimated by the authors to be 0.7% of the population as of 28 March; this is about 600,000 people, with a 95% probability that the number infected is between 240,000 and 1,500,000.
In Spain, the reproduction rate \(R_t\) (see box on the right in the picture above) remained around 5 in February and early March (slightly below), around 4 between 9 and 15 March, and down from 2, but still above 1 after the 15 March containment measures were implemented. In Italy \(R_t\) started at around 3.5, and in Germany around 4 (but in this case with far fewer actual infected). The fact that \(R_t\) remains above 1 in Spain shows that the epidemic has continued to spread after containment, but with much slower growth. To control the epidemic it is necessary for \(R_t\) to fall below 1 and stay there. Otherwise infections will continue and end when enough people have become infected to generate herd immunity. These data, therefore, more than justify the increased containment measures implemented by the government on 29 March. And they demand scrupulous and strict compliance by the entire population.
Magnífico artículo. ¿Conoce usted algún trabajo sobre la influencia de las condiciones climáticas en la expansión de la pandemia? Gracias
El principal problema de las disciplinas como la epidemiología o la economía es que sirven bien para explicar el pasado pero no tanto para predecir el futuro. Al final las predicciones se basan en estimaciones a ojo (de G0 en este caso) a partir de las cuales se desarrollan complejos modelos matemáticos con pies de barro.
Perdón, el artículo me ha sido de mucha ayuda para intentar entender conceptos. Seguramente no lo he conseguido del todo.