
This entry concerns the interpretation of official daily infection data. For some time now, the authorities have been informing us on a daily basis about the number of confirmed infections by PCR (Polymerase Chain Reaction), the cumulative infection rates at 7 and 14 days, etc. However, until very recently, it has not been required that the numbers to be taken into account when taking measures are not those of the day of the announcement, but those of at least five days before. The answer is very simple: as of today, only confirmed cases of covid-19 are counted, that is, those that have tested positive after having undergone one of the reliable diagnostic tests, known as AIDT (Active Infection Diagnostic Tests), and doing these tests and knowing the results is not instantaneous, it takes time, both to carry them out and to obtain the results and then communicate them. But the problem is even more complicated. To give the official daily figure, data from all the laboratories and hospitals where these tests have been performed must be compiled, and this also takes time, so it is to be expected that there will be a gap between the official number reported daily and the actual number (always according to PCR) of infections detected.
To show the above, we are going to use the official data published by the Junta de Andalucía on its website Informe COVID-19 en Andalucía, in particular the data on detected and confirmed infections (the real number of infected persons is impossible to know, it can only be estimated) in the whole of Andalusia, as well as those of the province of Seville.
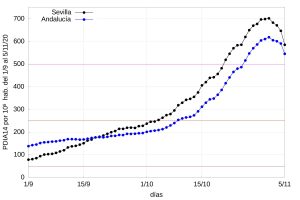
Let us take, for instance, the data published on 7 November on the number of detected and confirmed infections reported up to 6 November and let us plot the number of detected and confirmed cases by AIDT per day in Seville and Andalusia. For reasons that will be discussed later, we are going to show two graphs. The one above shows the infections up to 31 October (one week before the day we consult the data) and the one below shows the infections up to 6 November.
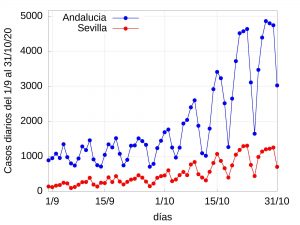

A simple glance at both charts shows a clear weekly (7-day) oscillation perhaps related to lags, although there is a fundamental difference between the two. The first graph clearly shows an upward trend week after week (especially if we look at the peaks) while the second one seems to show after the last peak a downward trend, which could be interpreted as a noticeable decrease in infections. To avoid fluctuation, a more uniform value, the number of 14-day cumulative cases per 100,000 inhabitants (cumulative incidence), is often used. Let us show the corresponding graphs:
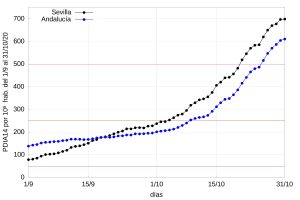
There is no doubt that the above graphs suggest that infections are actually decreasing, which would be good news. Nothing could be further from the truth.
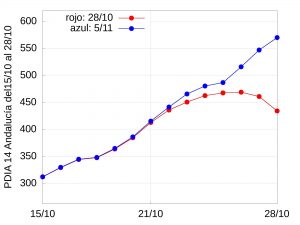
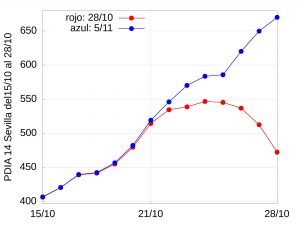
To demonstrate the futility of using the latest data published on a day-by-day basis, let us compare the infection data published on a given day with those published several days later. So, let’s take the data published on 29 October (which contains the infection data collected up to 28 October) and compare it with the data published on 7 November for Andalusia and Seville. The following graphs show the results of this comparison,

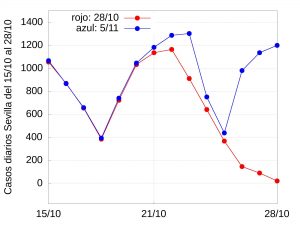
as well as the corresponding 14-day cumulative incidence per 100,000 inhabitants:
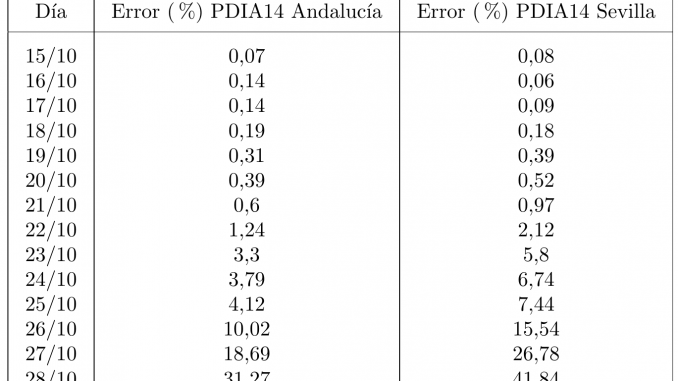
The following table shows the evolution of the error (in percent %) of the 14-day cumulative index per hundred thousand inhabitants in Andalusia and Seville:
If we plot the error data in a graph, we have the following figure:
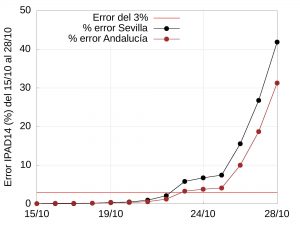
Both the table and the graphs above show a huge gap between the data published on 29 October and the same data updated on 7 November. Similar analyses of data collected between 16 September and 7 November lead to similar errors (this time around 30%).
All of the above shows, without the slightest possibility of doubt, that data cannot be used on the day they are published as they do not reflect the reality of the evolution of the pandemic. So the question naturally arises: how many days do we have to wait before we can rely on the infection data? From the example above it is clear that we should allow at least five to seven days.
Conclusion: If we use daily data, these data will only give us a reliable estimate of detected and confirmed cases 5 to 7 days before the date of publication of these data, i.e. we cannot use the data published on the last day if we want to know how the pandemic is evolving until that day. We need time for the data to consolidate, i.e. to get closer to the actual number of detected and confirmed infections. This obviously implies that we will only be able to know reasonably reliably the cumulative incidence rates with the same delay. Our calculations tell us that with the data published each day we can only know the actual situation (with a margin of error of less than 5%) from five days before and never on the day itself.
This fact should be kept in mind by health authorities, politicians and especially by the media, which in most cases tend to use the latest official data published that does not even remotely reflect reality (a margin of error of more than 30% seems somewhat excessive). Perhaps this is why the Ministry of Health established in the document entitled Actuaciones de respuesta coordinada para el control de la transmisión de COVID-19 (updated on 22 October) that “These CIs (cumulative indices) should be calculated with consolidated data, subtracting the days on which such consolidation is considered insufficient”, which in the case of Andalusia, as we have seen, are between five and seven days.
Leave a Reply