
In the last few days, many media have been echoing a mathematical model developed by researchers at the MIT (Massachusetts Institute of Technology) and published on 3 November 2020, which attempts to estimate the time it takes for a person to become infected when in the same room as a carrier of SARS-CoV-2, which causes covid-19, depending on different parameters: size of the room, ventilation, type of mask, etc., and assuming that the only form of contagion is airborne (i.e. by aerosols). In this post we will briefly discuss the results of this work, which is still in the process of peer review (i.e. it has not yet been accepted in any research journal).
It is well known that when we breathe, talk, cough and sneeze we exhale an enormous amount of saliva droplets, and that these droplets contain a large number of micro-organisms, including, if we are ill, various pathogens such as SARS-CoV-2, the virus responsible for the global covid-19 pandemic. The size of these droplets varies over a wide range and depends on whether we only breathe, whether we talk, sing, etc. In the case of sneezing and coughing, droplet size ranges from 100 to 1000 micrometres and droplets usually fall quickly to the ground (discussed in a previous post). However, when we speak and breathe we also expel droplets whose radii vary between 0.25 and 2.5 micrometres. These droplets, which are much smaller than those expelled when coughing or sneezing, are known as aerosols and tend to remain in suspension for several hours in a poorly ventilated room and are therefore likely to be inhaled by anyone in the room. It is also known that if SARS-CoV-2 is present in these aerosols, it remains active for hours (we have already discussed the life span here), so that aerosols can be a route of transmission of many diseases (this fact is well documented in scientific literature) including covid-19. While at the beginning of this pandemic the airborne route had been ruled out, there is now increasing evidence that this is one of the most likely ways of disease transmission (ver por ejemplo https://www.pnas.org/content/117/26/14857).
The paper in question, entitled Beyond Six Feet: A Guideline to Limit Indoor Airborne Transmission of COVID-19, can be downloaded here.
The goal of the authors is to find a way to estimate the time it takes for a SARS-Cov-2 carrier to infect another person in the same room, assuming that the route of transmission is through the air, i.e. via aerosols. We must say that, although the original manuscript is arid to read and the calculations are quite complicated to reproduce, it has two indisputable advantages: #1 the formula deduced by the authors and on which they base their recommendations (A Guideline to Limit Indoor Airborne Transmission of COVID-19) is very simple and easy to use and analyse, and #2 they have an interactive website that any internet user can access to calculate these times. In fact, the formula deduced establishes what in mathematics we call a boundary. Specifically, the authors establish an estimate of how long we can stay with an infected person in the same closed room before another person becomes infected, i.e. a safety time.
Before writing the above-mentioned formula, we must explain the parameters on which it depends. These parameters are:
- \(N\), the number of people in the room,
- \(V\), the volume of the room \(V=A\cdot h\), where \(A\) is the area and \(h\), the height),
- \(Q_b\), the volume of air per unit time expelled by a person, which depends on the activity the person is doing, e.g. sitting, resting, talking quietly, talking loudly, playing sports, etc. (it is assumed that everyone in the room is doing the same activity),
- \(\lambda_c\), the air turnover rate per unit time (which is determined by the type of ventilation in the room: closed windows (no ventilation), open windows, mechanical ventilation, etc.) and includes some corrections such as the rate of virus deactivation, or the rate of filtering (e.g. if there is a HEPA filter, etc.),
- \(p_m\), the penetration factor of the mask, which takes values between 0 and 1 with 0 being no droplets when breathing or talking and 1 being all droplets (a good fitting mask has a value of 0.1 to 0.05),
- \(\epsilon\), the model tolerance which we will explain a little later,
- \(C_q\), the concentration of exhaled viral particles per unit volume which will be determined by the viral load of the virus carrier and which is, according to the same authors, the most controversial parameter of the model.
The time \(\tau\) needed for a person to become infected by aerosols is given by the following boundary value
$$\tau< \frac{\epsilon \lambda_c \, V}{N\, Q_b^2 \, p_m^2 \, C_q}$$
From the above formula we can deduce a whole strategy to increase the time before the first contagion occurs, i.e. the safety time against possible contagions. Thus we have that the safety time decreases if:
1. the size of the room decreases: the smaller the room (smaller V), the faster the first person will be infected.
2. Ventilation is worse (lower \(\lambda_c\)).
3. The respiratory flow is high (large \(Q_b\)). Breath flow is higher the louder you talk, or if you are doing physical exercise, for example.
4. The mask is bad, or you don’t wear a mask so \(p_m\) is large.
5. The virus carrier has a high viral load and is doing some activity that makes him/her expel a lot of air (\(C_q\) is large).
Of all the above parameters, the only one that is currently unknown (remember that the tolerance is arbitrarily set according to the risk to be taken) is the concentration of viral particles per unit volume \(C_q\) exhaled by the infected person. To obtain the values of this parameter, the authors make certain estimates from well-known and well-documented cases, but to date there is no fairly rigorous way of getting this number. For example, they estimate that singing is what produces a larger \(C_q\) of over 900 particles per cubic metre, which is huge compared to just talking, which corresponds to 72 particles per cubic metre, or breathing, which they estimate to be between 10 and 30 particles per cubic metre. Note that this term is very relevant because the higher it is the less safety time we have. The rest of the parameters can be estimated or calculated experimentally, although, as in the case of \(\lambda_c\), the calculation can be extremely cumbersome as it depends on a huge number of parameters.
It is remarkable that almost all media have reported on this model on the occasion of the upcoming Christmas gatherings. Just type in the google search engine “modelo matemático tiempo contagio MIT” (in English “MIT contagion time mathematical model“) and you will find headlines such as “The mathematical model that shows the risk of contagion among 10 people at Christmas dinners” or “10 people without masks at Christmas dinner? How the risk of contagion changes depending on the space and the attendees” and many more, all talking about Christmas as if the authors had written their guide with the upcoming Christmas gatherings in mind. The reality is quite different. In the paper, the two examples (case studies, as the authors call them) that are analysed are the contagion time in a typical classroom in the USA (which according to the authors has an area of 83 square metres and a volume of 306 cubic metres) occupied by 20 people, and a room in a nursing home, also in the USA (which according to legislation has to have a minimum area of 22 square metres and a volume of 53.5 cubic metres) shared by three people.
In any case, if we use the above formula for a room of 20 square metres and a height of 2.5 metres, the formula predicts a safety time that we will represent in the following graphs:

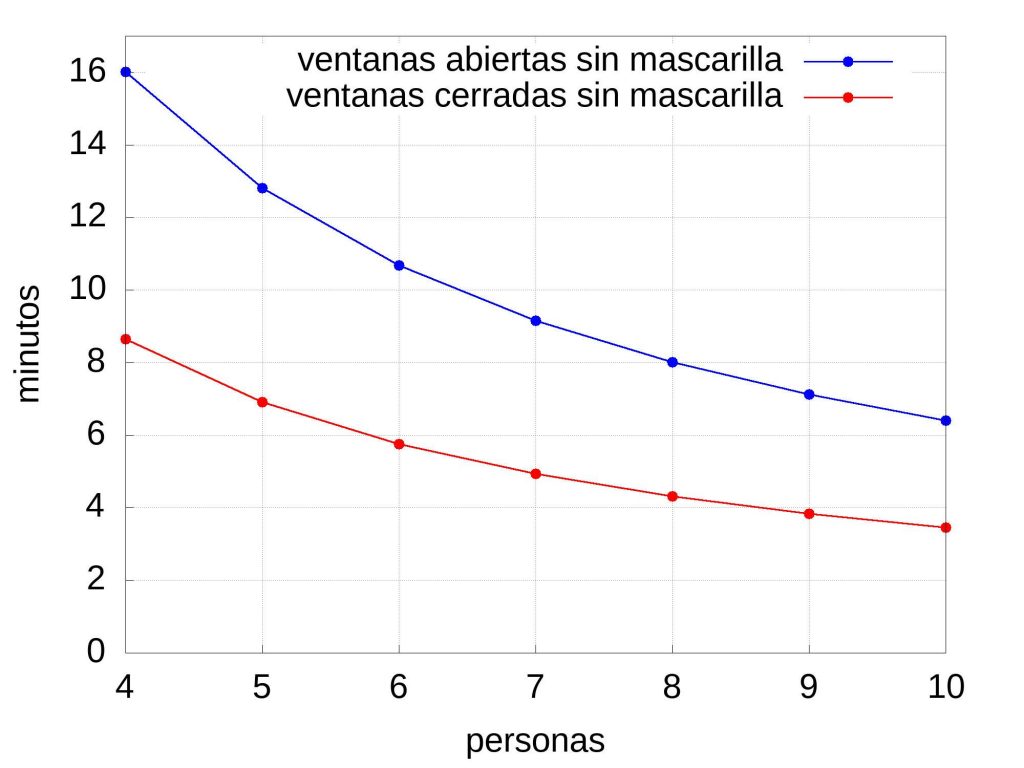
To achieve these graphs, the parameters obtained from the authors’ web app were used. Thus, it has been assumed that there is no mechanical ventilation, no filtration system (the value of \(\lambda_c\) would increase) and that people are seated, \(Q_b=0.49 m^3/hr\), and speaking normally, \(C_q=72\) particles per cubic metre. If the windows are open, the exchange rate \(\lambda_c\) is 3.05 per hour, and if they are closed it is 1.35 per hour. If people wear a surgical mask and it fits properly then \(p_m=0.15\) and if they do not wear masks, \(p_m=1\). The \(\epsilon\) tolerance has been set to default to 0.1 as the authors do on their website. Any change of the tolerance drastically changes the security time, for example if there are very vulnerable people in the meeting the authors recommend to use \(\epsilon\)=0.01. It must be said that the results obtained using the simplified formula above are quite similar to those obtained on the web if the parameters mentioned above are fixed (in fact the times reported in the media do not correspond to those shown here, but if we change the activity of the people the values of \(Q_b\) and \(C_q\) can increase significantly, which makes the security time decrease).
Before closing this entry, it is worth clarifying several things. The first is that the final formula is obtained after a large number of assumptions and approximations and has not been experimentally tested, i.e. no controlled experiment has been carried out to estimate the veracity of the results (in this case the contagion time). This implies that the results obtained are essentially speculative, there is no experimental support and therefore the estimated times must be taken for what they are: a qualitative (rather than quantitative) guide. This is important because a mathematical model becomes a plausible theory if it passes through the filter of the scientific method (which we have already discussed in several posts on this blog). The second, as we have seen, is that among the parameters used there are two that are far from being able to be determined efficiently (as they themselves explain in their work) experimentally. The first of these is what the authors call the \(\epsilon\) tolerance. This number ranges between 0 and 1 and determines the assumable risk, which in epidemiological models is a universal constant independent of the model in question (i.e. it is fixed in advance regardless of the model used, in this case the authors have set it at 0.1). Specifically, the tolerance \(\epsilon\) is set so that the probability of the first contagion occurring is less than this \(\epsilon\). If \(\epsilon\) is small, this indicates a high-risk situation where the probability of contagion is intended to be low, and a high \(\epsilon\) indicates a lower-risk situation. In the authors’ words, when estimating the time inside a classroom where the risk of covid-19 complications is apparently low, \(\epsilon\) will be taken as “large” (e.g. 0.1) but in a nursing home room where it is better not to “experiment” it is taken as small: 0.01 (high risk). It is clear that safety times will be shorter if the \(\epsilon\) is small. The second is related to the viral load of the infected person, the \(C_q\), of which there is little information and which the authors estimate rather loosely (in the opinion of the author of this entry). Finally, it should also be said that the \(\lambda_c\) parameter used by the authors in the web application (and which we have taken here) is the one that is legally established (an interesting discussion of this can be found both in the work and in the supplementary materials), but it would be right to use the ones corresponding to the room we are interested in. This option is possible in the web application, but the reader of these lines will probably feel the same as the author of these lines: that it is impossible to have this information available.
Therefore, in conclusion, it is best to stick to the following maxim: avoid enclosed spaces with many people, make sure there is good ventilation, put on a mask and wait for better times. Oh, and don’t even think of singing (the \(C_q\) is huge). Sooner or later, thanks to science, this pandemic will be brought under control and we will be back to normal.
For more details on the model, please visit the authors’ website at
https://web.mit.edu/bazant/www/COVID-19/
as well as the website of the application
Espectacular,
Soy matemático; me autorizan a hacer uso de este articulo para adaptarlo a un lenguaje mas sencillo para las personas que no son matemáticos?
Gracias